Because Accelerator Impact Report

Measuring the effectiveness of our work supporting entrepreneurs.

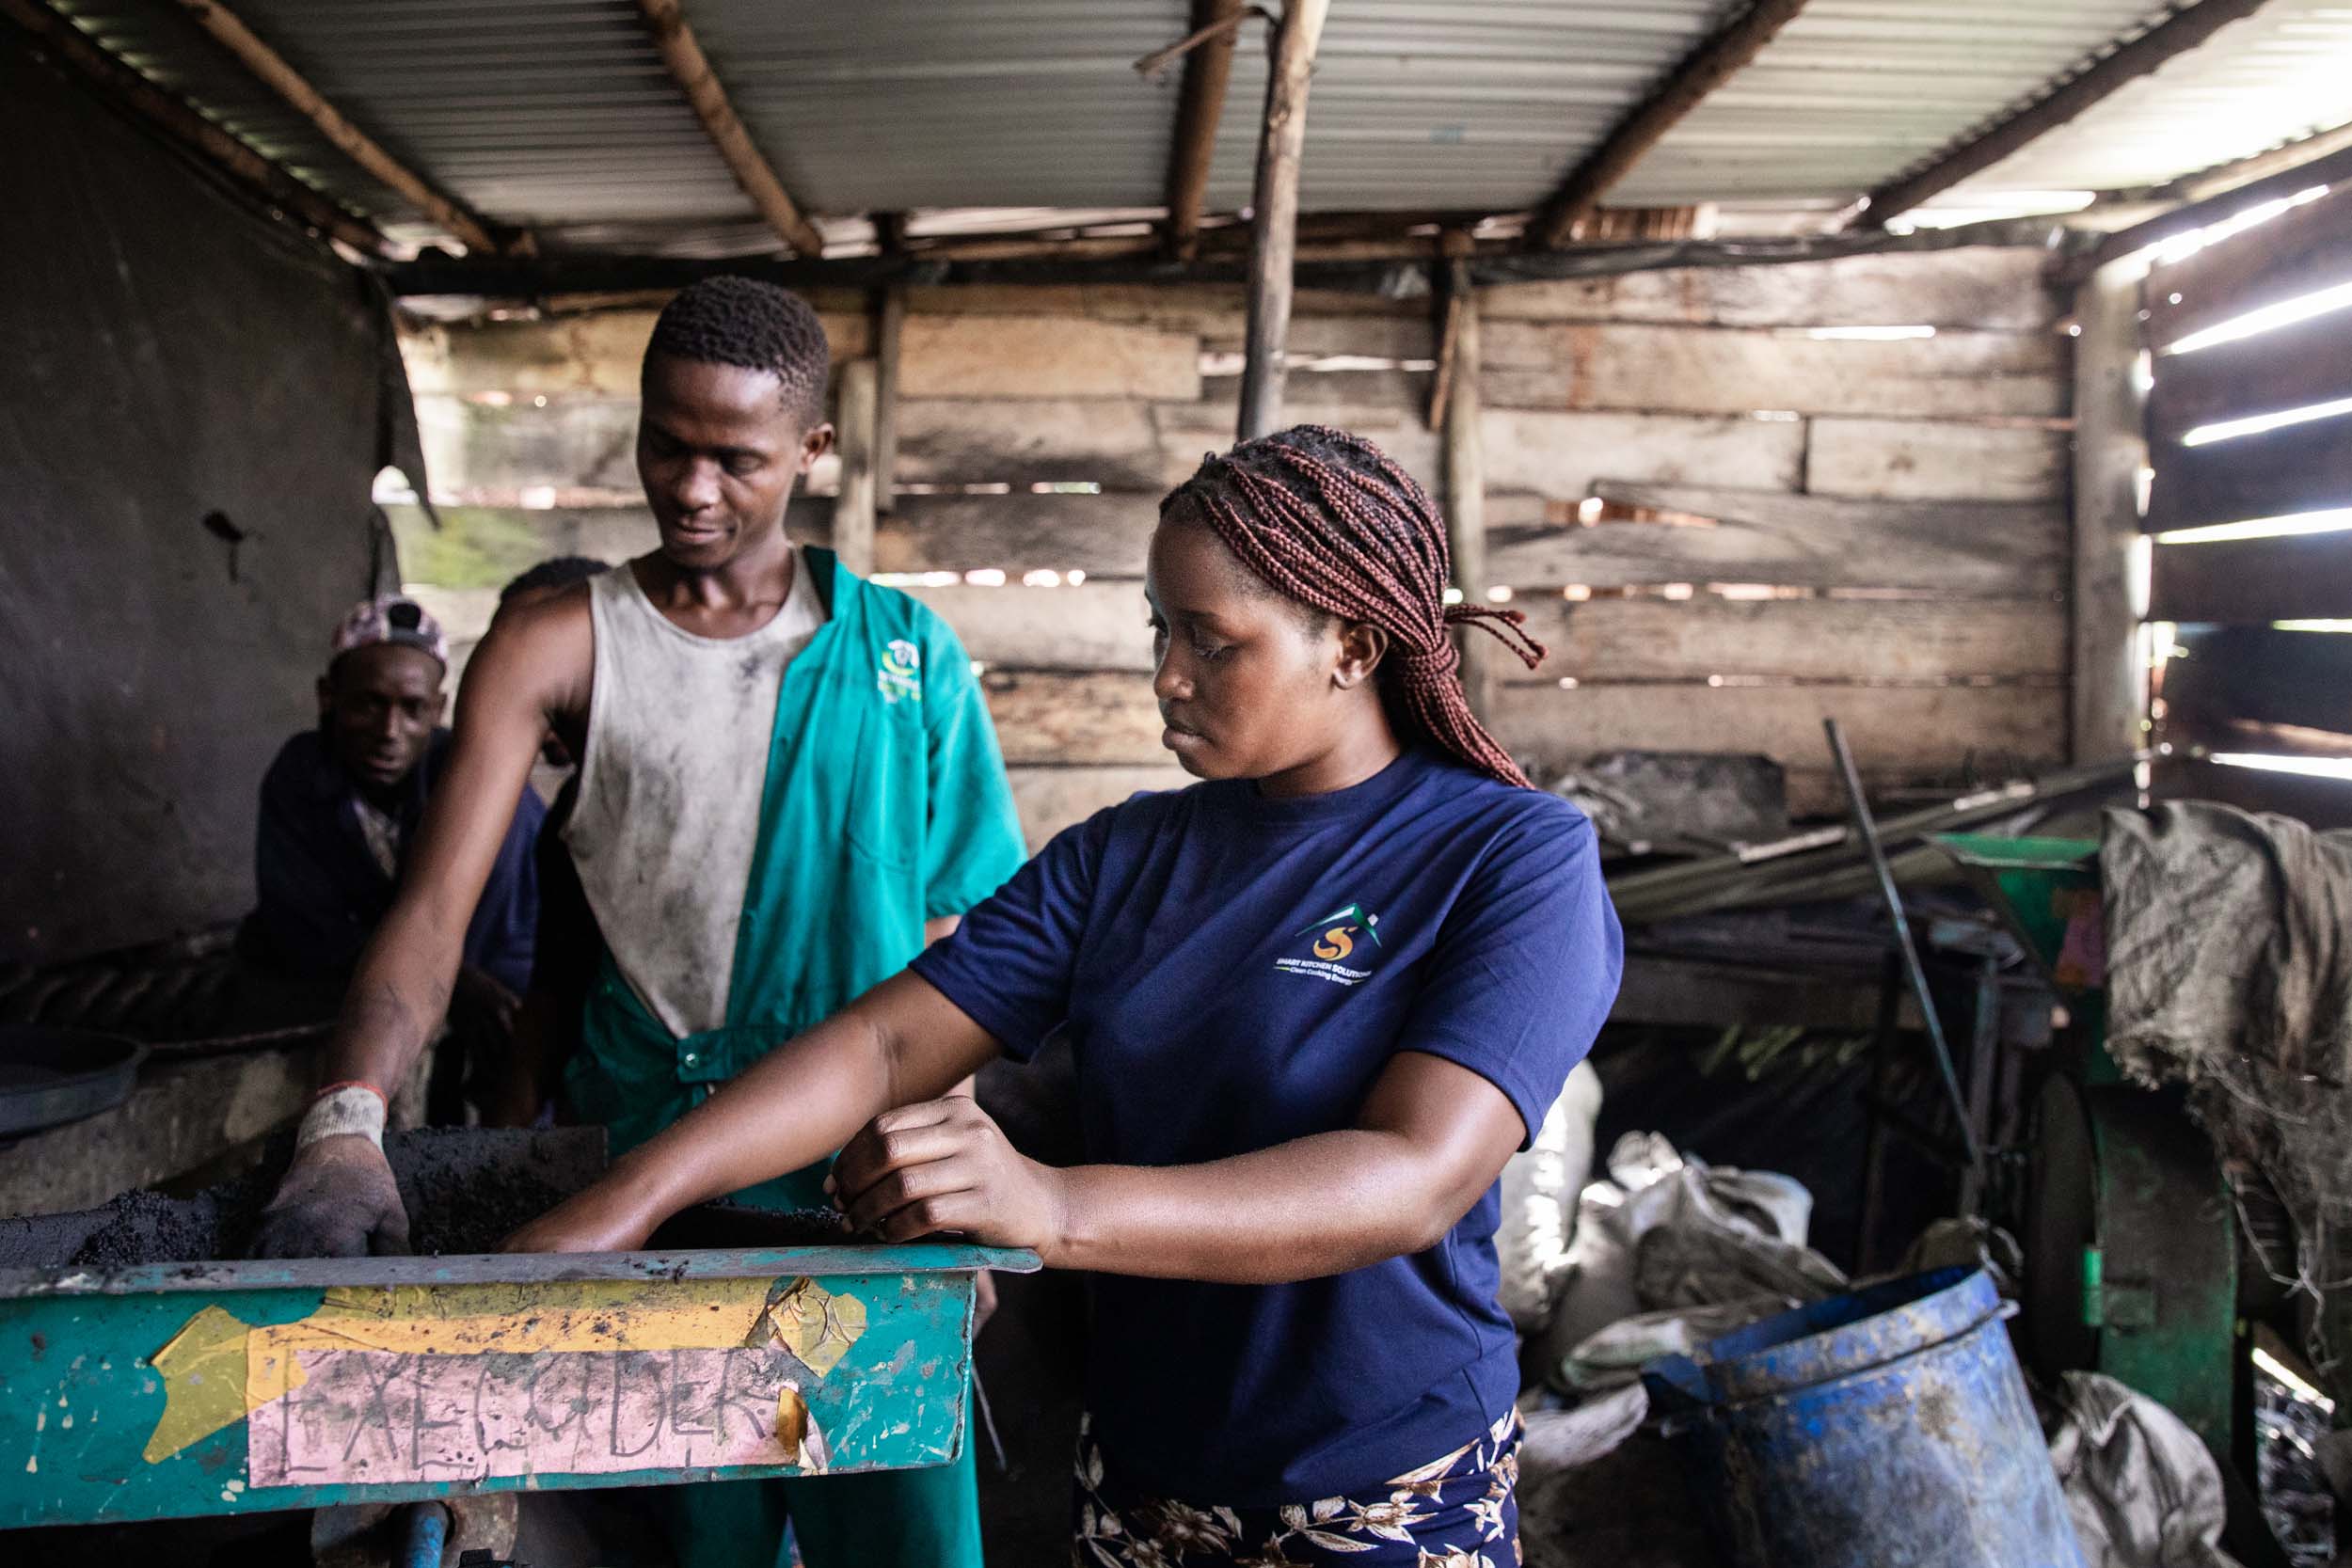
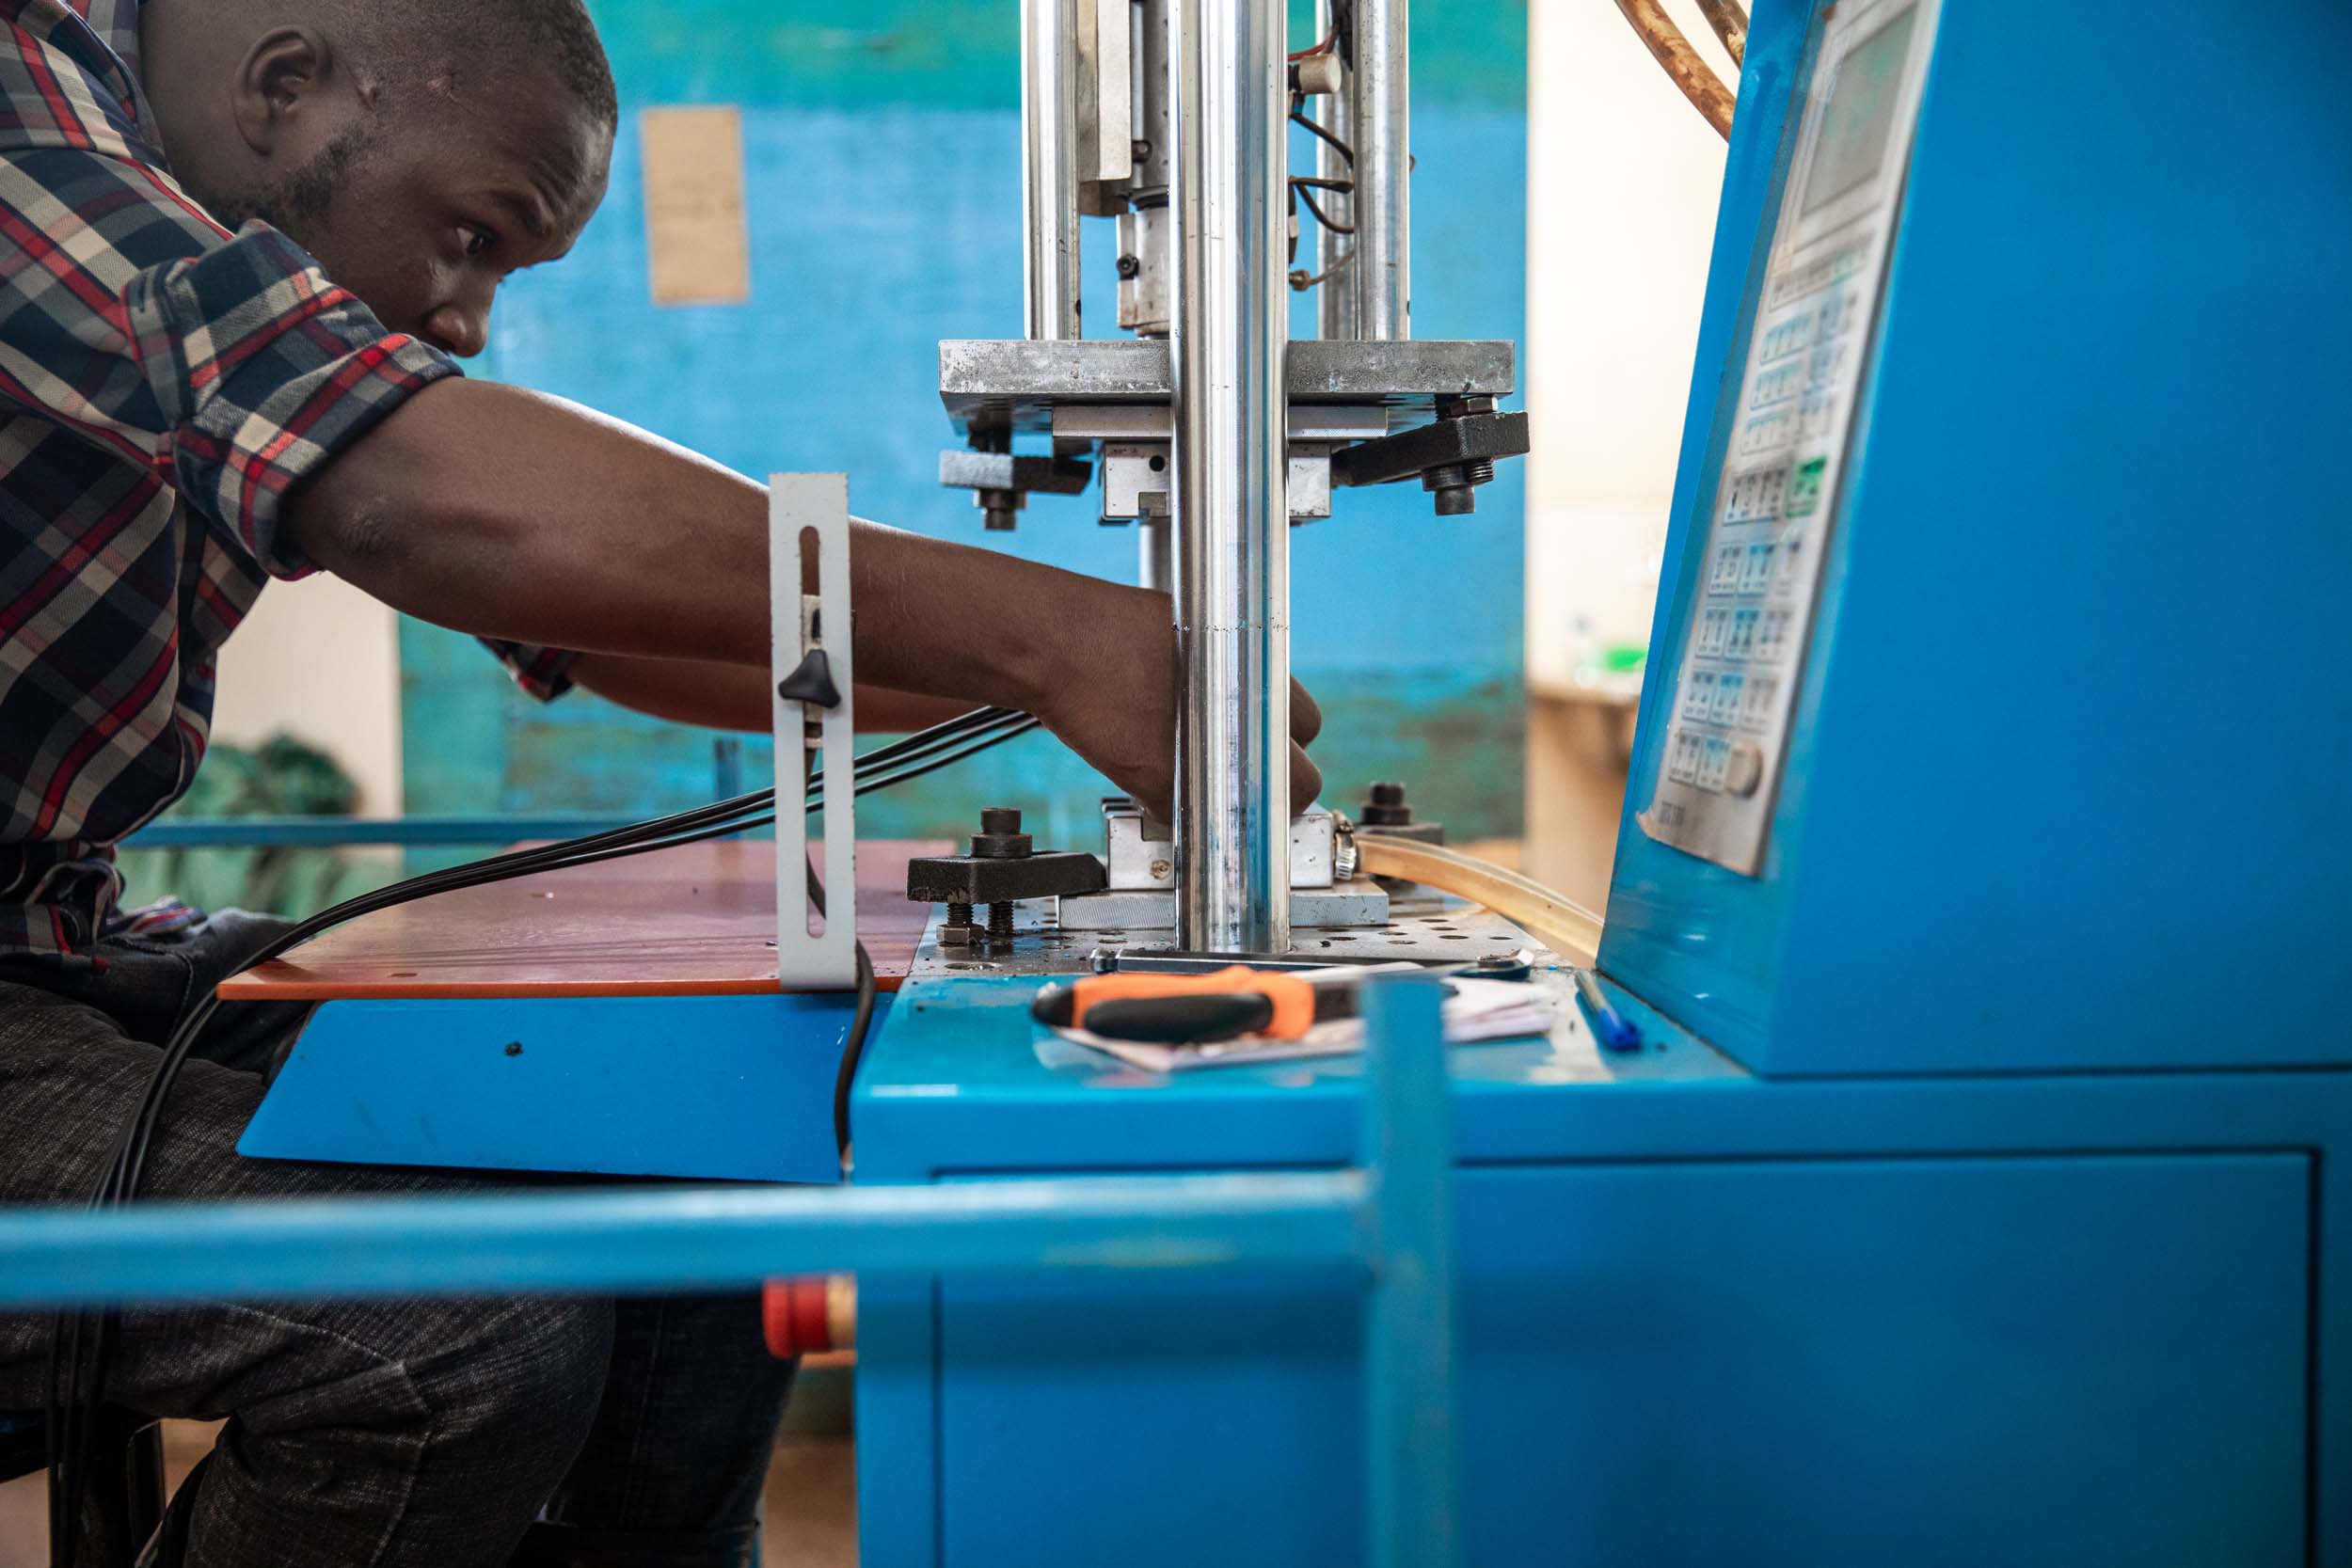
One way that we measure the effectiveness of the Because Accelerator is by conducting annual surveys with alumni. Below you will find data from surveys gathered in 2022 from entrepreneurs around the world in areas impacted by poverty.

Impact_graph_-11.png
Alumni by region

Since our first cohort in 2019, we have worked with 113 entrepreneurs around the world as represented by this map. Our largest cohort was in 2023 with 24 entrepreneurs.

yellow-background.png

Percentage of female entrepreneurs

42%

yellow-background.png

Total jobs created

2463

yellow-background.png

Total applications reviewed

1216

yellow-background.png

Total number of cohorts

10

Accelerator_impact_graph_-09.png
Funding distributed by region

Funding is distributed in the form of prize funds from pitch and impact competitions, one-time grants and recoverable grants.

In total, 38 entrepreneurs have received $197,150 in funding since the launch of the Because Accelerator.

yellow-background.png

Total customers served

4,435,180

yellow-background.png

Total revenue generated

$6,900,390

yellow-background.png

Total beneficiaries

12,119,794

yellow-background.png

Total units sold

61,266,300

Accelerator_impact_graph_-18.png
UN SDG representation

12 of the 17 UN Sustainable Development Goals are represented by alumni of the program. Within the top 10 companies for job creation, the UN SDG’s that saw the most growth were:

  • Climate Action
  • Decent Work & Economic Growth
  • Sustainable Cities & Communities.

The two UN SDG’s with the most revenue reported were Responsible Consumption & Production and Decent Work & Economic Growth.

EverGrow-05.jpg
Smart_Kitchen-09.jpg
Uganics-08_d3c79987-7d57-4a8f-96f6-8734b6166b0a.jpg
TotoSci_2023-05_dff7f7b0-b9d0-4c3e-a979-683f3630d900.jpg